Bar Graph Worksheets
Updated October 2026 · 4 free printables
Read and make bar graphs: a favorite pets graph to read, a weather tally chart to turn into a bar graph, a horizontal bar graph about sports with a scale of 2, and a food drive graph that counts by 5s.
Printable PDFs for 1st to 3rd grade, each with questions and an answer key.
All 4 Bar Graph Worksheets, One by One
Here is a closer look at every page in this collection: what it practices, which grade it fits and a tip for each one.
-
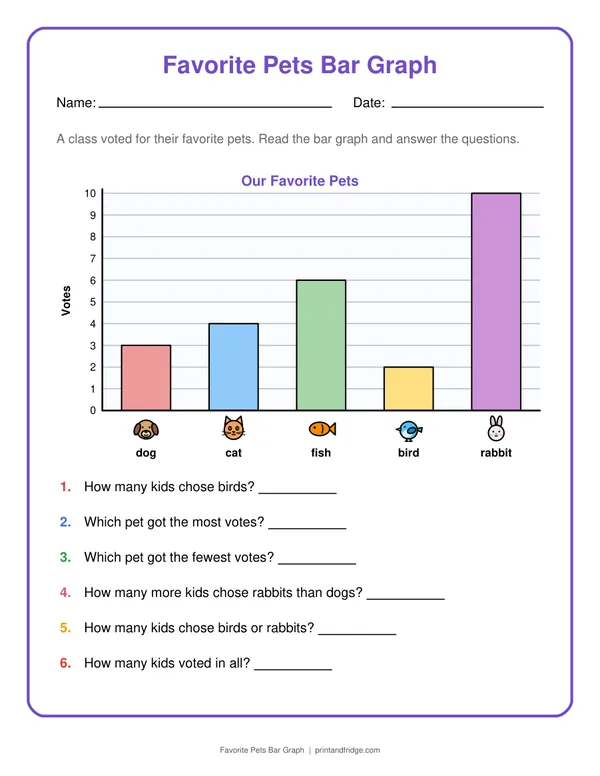
1. Favorite Pets Bar Graph
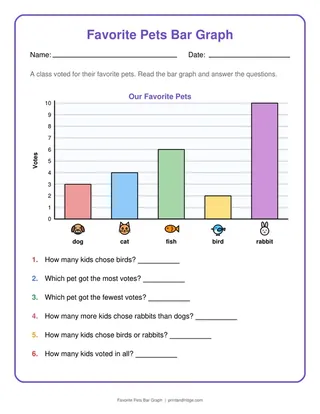
A free printable favorite pets bar graph worksheet with an answer key. A class voted for their favorite pets. Read the bar graph and answer the questions. It matches first grade goals, roughly ages 6 to 7.
-
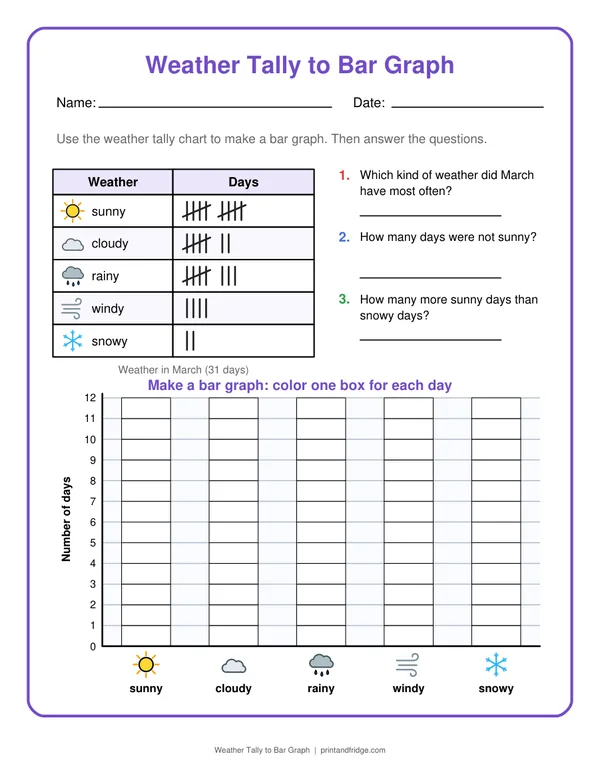
2. Weather Tally to Bar Graph
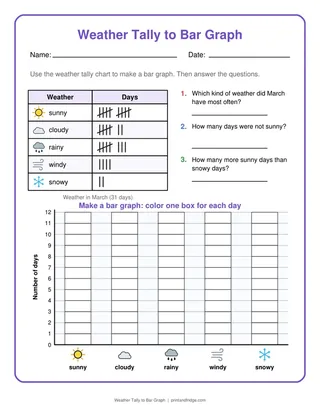
A free printable weather tally to bar graph worksheet with an answer key. Use the weather tally chart to make a bar graph. Then answer the questions. It matches first grade goals, roughly ages 6 to 7.
-
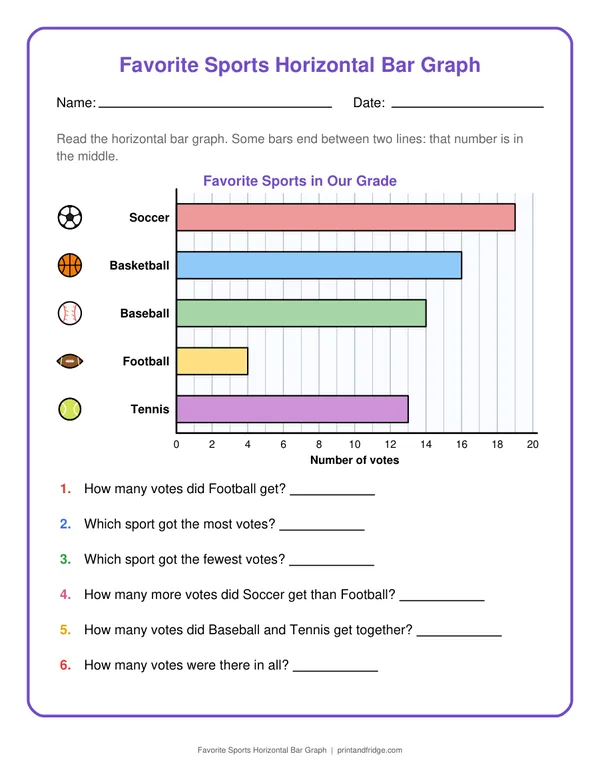
3. Favorite Sports Horizontal Bar Graph
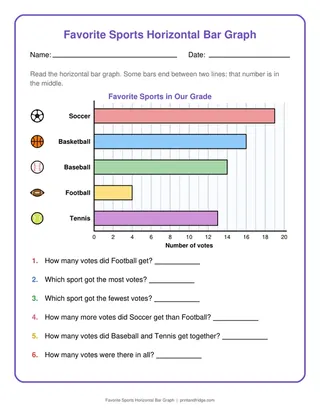
A free printable favorite sports horizontal bar graph worksheet with an answer key. Read the horizontal bar graph. Some bars end between two lines: that number is in the middle. It fits second grade, around ages 7 to 8.
-
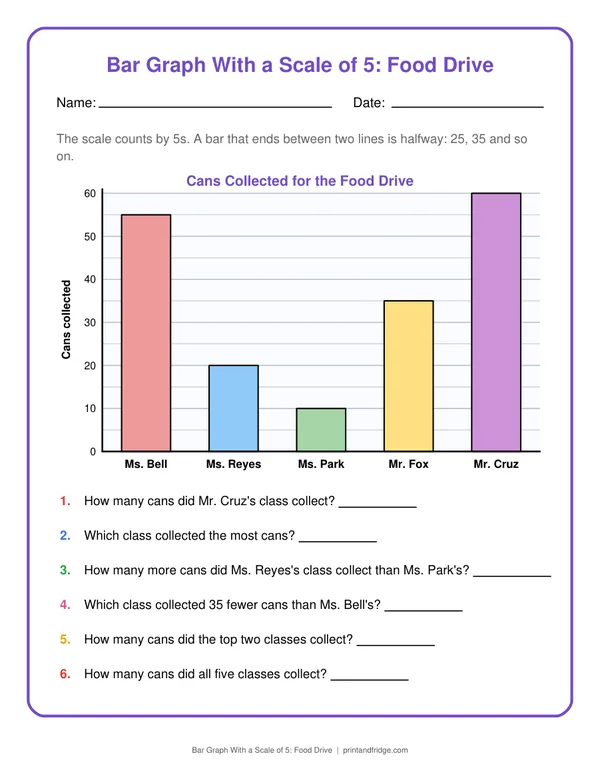
4. Bar Graph With a Scale of 5: Food Drive
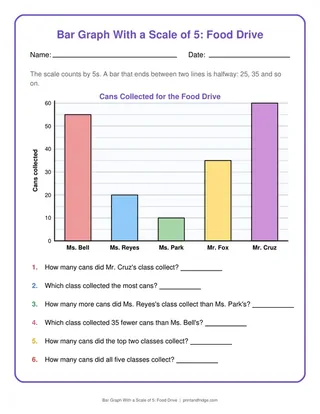
A free printable bar graph with a scale of 5: food drive worksheet with an answer key. The scale counts by 5s. A bar that ends between two lines is halfway: 25, 35 and so on. It is aimed at third grade, around ages 8 to 9.
Tips for bar graph worksheets
- Slide a ruler or your finger from the top of each bar straight across to the scale so you read the right number.
- Look at the scale before reading any bar: if it counts by 2s or 5s, each line on the graph is worth more than one.
- When making a bar graph, draw every bar the same width with equal gaps, so only the height or length changes.
Fun math facts
- Bar graphs can stand up or lie down, and sideways bars are handy when the labels are long words.
- A bar graph compares groups, while a line graph shows how one thing changes over time, like the temperature through a day.
- A bar graph whose scale does not start at 0 can make small differences look huge, so always check the bottom number.
Fun ways to use your printables
- Count the colors of cars passing your house for ten minutes and turn the tally into a bar graph.
- Make a bar graph of how many books each family member reads in a month and add to it every week.
- Build a bar graph from stacked blocks first, one tower for each group, then draw the same graph on paper.
How to print
Click Download PDF and print at 100% on US Letter or A4 paper. Page 1 is the worksheet and page 2 is the answer key, so choose “page 1” in the print dialog if you only want the practice page. Every worksheet is free for home, homeschool and classroom use, so print as many copies as you need.
Frequently asked questions
How do you read a bar graph?
Find the bar, follow its top edge across to the number line, and read the number. If the bar ends between two lines, the value is halfway between those numbers.
What should a bar graph always have?
A title, labels for each bar, and a number scale that starts at 0 and goes up in equal steps.